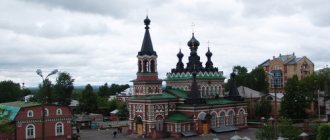
Urban settlements
- Selenginsk
Population 13,500 (2020).
- Onokhoy
Population 10,837 (2020).
- Taximo
Population 7,691 (2020).
- Ust-Barguzin
Population 6,955 (2020).
- Kamensk
Population 6,607 (2020).
- Zaigraevo
Population 5,138 (2020).
- Nizhneangarsk
Population 4,209 (2020).
- New Uoyan
Population 3,025 (2020).
- Headphones
Population 2,821 (2020).
- Kichera
Population 946 people (2020).
- Severomuisk
Population 683 people (2020).
- Yanchukan
Population 259 people (2020).
Buryatia. Districts
The Republic of Buryatia is part of the Russian Federation. In addition, it is part of the Siberian Federal District. The administrative center is the city of Ulan-Ude.
The territory is dominated by a sharply continental climate. In this regard, the winter period here is cold, almost snowless. Spring in this area is windy. This time of year is characterized by frost and low rainfall. The summer season is very short, the days are hot and the nights are cool. The greatest amount of precipitation falls between July and August. Autumn is most often long and warm, without sudden changes in temperature.
Buryatia. Map (The dotted line indicates the borders of the republic on the map)
The average summer temperature in Buryatia is +19C, in winter the average temperature is -22C. About 244 mm of precipitation falls annually. The local population is 971,391 people. Population density indicators are 2.76 people per 1 km2. Slightly more than half of the population (58.84%) lives within the city.
Regions of Buryatia:
1. Barguzinsky district - the village of Barguzin 2. Bauntovsky district - the village of Bagdarin 3. Bichursky district - the village of Bichura 4. Dzhidinsky district - the village of Petropavlovka 5. Eravninsky district - the village of Sosnovo-Ozerskoye 6. Zaigraevsky district - the village of Zaigraevo 7. Zakamensky district - city Zakamensk 8. Ivolginsky district - the village of Ivolginsk 9. Kabansky district - the village of Kabansk 10. Kizhinginsky district - the village of Kizhinga 11. Kurumkansky district - the village of Kurumkan 12. Kyakhtinsky district - the city of Kyakhta 13. Muisky district - the village of Taksimo 14. Mukhorshibirsky district - the village of Mukhorshibir 15. Okinsky district - the village of Orlik 16. Pribaikalsky district - the village of Turuntaevo 17. Severo-Baikalsky district - the village of Nizhneangarsk 18. Selenginsky district - the city of Gusinoozersk 19. Tarbagataysky district - the village of Tarbagatay 20. Tunkinsky district - the village of Kyren 21. Khorinsky district - the village Khorinsk
Administrative-territorial division of the Republic of Buryatia Map by region
Buryatia is located in the central part of the Asian continent, occupying part of Eastern Siberia. The republic has borders with the Irkutsk region (north and west), with Mongolia (south), with the Republic of Tyva (far west), with the Trans-Baikal Territory (east).
Cities and towns:
- Ulan-Ude
- Ivolginsk
- Severobaykalsk
- Gusinoozersk
- Kyakhta
- Selenginsk
- Zarechny
- Zakamensk
- Onokhoy
- Bichura
- Taximo
- Khorinsk
- Petropavlovka
- Kamensk
- Ust-Barguzin
see also
- Buryatia
- Symbols and sights of Buryatia
- Cities of Russia
| [ + ] Cities by regions of Russia | |
| Cities of the North-West (NWFD) | St. Petersburg (and its cities) • Leningrad region (historical Staraya Ladoga) • Arkhangelsk region • Vologda region • Kaliningrad region • Karelia • Komi • Murmansk region • Nenets Autonomous Okrug • Pskov region |
| Cities of the Volga region (Volga Federal District) | Bashkortostan • Volgograd region • Kalmykia • Kirov region • Mari El • Mordovia • Nizhny Novgorod region • Orenburg region • Penza region • Perm region • Samara region • Saratov region • Tatarstan • Udmurtia • Ulyanovsk region • Chuvashia |
| Cities of Southern Russia (SFD) | Sevastopol (including Inkerman) • Republic of Crimea • Adygea • Astrakhan region • Krasnodar region • Rostov region |
| Cities of the North Caucasus (NCFD) | Dagestan • Ingushetia • Kabardino-Balkaria • Karachay-Cherkessia • North Ossetia - Alania • Stavropol Territory • Chechen Republic |
| Cities of the Urals (Ural Federal District) | Kurgan region • Sverdlovsk region • Tyumen region • Khanty-Mansi Autonomous Okrug - Yugra • Chelyabinsk region • Yamalo-Nenets Autonomous Okrug |
| Cities of Siberia (Siberian Federal District) | Altai Republic • Altai Territory • Irkutsk Region • Kemerovo Region • Krasnoyarsk Region • Novgorod Region • Novosibirsk Region • Omsk Region • Tomsk Region • Tyva • Khakassia |
| Cities of the Far East (FEFD) | Amur Region • Buryatia • Jewish Autonomous Region • Trans-Baikal Territory • Kamchatka Territory • Magadan Region • Primorsky Territory • Sakha (Yakutia) • Sakhalin Region • Khabarovsk Territory • Chukotka Autonomous Region |
| see also | Cities of the DPR, LPR, Transnistria, South Ossetia • Regions of Russia • Cities of Russia |
CITIES OF THE REPUBLIC OF BURYATIA
| Population (estimated as of January 1, 2009), thousand people: Republic of Buryatia total population - 960.8 men - 453.9 women - 506.9 Ulan-Ude total population - 340.2 men - 155.7 women - 184 ,5 Population density (as of January 1, 2009), people per 1 km2: Republic of Buryatia - 2.7 Ulan-Ude1) - 989.8 | Administrative-territorial division of the Republic of Buryatia as of January 1, 2009 Districts - 21 Cities - 6 Intra-city districts, city districts - 3 Urban-type settlements - 16 Cities (number of inhabitants - estimate as of January 1, 2009, thousand people): Ulan-Ude - 340.2 Severobaikalsk - 25.5 Gusinoozersk - 23.7 Kyakhta - 19.4 Zakamensk - 13.1 Babushkin - 4.9 Territory area, thousand km2: Republic of Buryatia - 351.3 Ulan-Ude1) - 0.377 |
__________ 1) Including settlements subordinate to the city administration.
GROUPING CITIES BY PERMANENT POPULATION1)
| Total | including the number of inhabitants, thousand people | ||||||||||
| until 3 | 3 — 4,9 | 5 — 9,9 | 10 -19,9 | 20 — 49,9 | 50 — 99,9 | 100 — 249,9 | 250 — 499,9 | 500 — 999,9 | 1 million or more | ||
| Number of cities | |||||||||||
| 2008 | 6 | — | 1 | — | 2 | 2 | — | — | 1 | — | — |
| 2009 | 6 | — | 1 | — | 2 | 2 | — | — | 1 | — | — |
| Population, people | |||||||||||
| 2008 | 427785 | — | 4863 | — | 32380 | 49696 | — | — | 340846 | — | — |
| 2009 | 426848 | — | 4918 | — | 32495 | 49188 | — | — | 340247 | — | — |
| __________ 1) Estimate as of January 1. | |||||||||||
DISTRIBUTION OF POPULATION OF ULAN-UDE BY AGE GROUPS1) (thousands of people)
| Ulan-Ude | ||
| 2008 | 2009 | |
| Whole population | 340,8 | 340,2 |
| including those aged: | ||
| younger than able-bodied | 62,2 | 63,2 |
| of which children aged 1-6 years | 25,7 | 27,2 |
| able-bodied2) | 223,6 | 220,8 |
| older than able-bodied | 55,0 | 56,2 |
| __________ 1) Estimate as of January 1. 2) Men 16-59 years old, women 16-54 years old. | ||
SHARE OF ULAN-UDE IN THE MAIN SOCIO-ECONOMIC INDICATORS OF THE REPUBLIC OF BURYATIA in 2008 (percent)
| Ulan-Ude1) | |
| Population (est. January 1, 2009) | 38,9 |
| Average annual number of employees of organizations2) | 47,0 |
| Availability of fixed assets of organizations3) (at the end of the year) | 29,9 |
| Volume of shipped goods of own production, work and services performed in-house by type of activity2): | |
| mining | — |
| manufacturing industries | 80,5 |
| production and distribution of electricity, gas and water | 47,8 |
| Scope of work performed for the type of activity “Construction”2) | 14,7 |
| Commissioning of the total area of residential buildings | 61,3 |
| Retail trade turnover2) | 52,2 |
| Investments in fixed assets2) | 58,4 |
| __________ 1) Including settlements subordinate to the city administration. 2) For organizations not related to small businesses. 3) At full book value; for commercial and non-profit organizations (excluding small businesses). | |
SOCIO-ECONOMIC CHARACTERISTICS OF ULAN-UDE1)
| 2007 | 2008 | |
| POPULATION | ||
| Population (end of year estimate), thousand people | 372,4 | 373,3 |
| Number of births per 1000 population | 15,0 | 15,2 |
| Number of deaths per 1000 population | 12,7 | 12,5 |
| Natural increase, decrease (-) per 1000 population | 2,3 | 2,7 |
| WORK | ||
| Average annual number of employees of organizations2), thousand people | 115,5 | 109,8 |
| The number of unemployed citizens who applied for assistance in finding suitable work at government employment service institutions (at the end of the year), people | 2465 | 2655 |
| of them are recognized as unemployed | 2289 | 2581 |
| LIVING STANDARD OF THE POPULATION AND SOCIAL SPHERE | ||
| Average monthly nominal accrued wages2), rub. | 13150 | 16964 |
| Average size of assigned pensions, rub. | 3655,7 | 4512,6 |
| Number of pensioners, thousand people | 83,0 | 86,0 |
| Total area of residential premises per average city resident (at the end of the year), m2 | 19,0 | 19,4 |
| Number of preschool educational institutions | 79 | 80 |
| in them: | ||
| children, thousand people | 14,6 | 15,3 |
| places, thousand | 11,3 | 11,4 |
| Enrollment of children in preschool educational institutions (at the end of the year), as a percentage of the number of children of the corresponding age | 59,3 | 53,2 |
| Number of daytime educational institutions (at the beginning of the school year) | 77 | 73 |
| Number of students in daytime general education institutions, thousand people | 41,3 | 40,8 |
| Number of doctors, people: | ||
| Total | 2587 | 2547 |
| per 10,000 population | 69,5 | 68,2 |
| Number of nursing staff, people: | ||
| Total | 5341 | 5360 |
| per 10,000 population | 143,4 | 143,6 |
| Number of hospitals | 23 | 24 |
| Number of hospital beds: | ||
| total, thousand | 4,9 | 4,4 |
| per 10,000 population | 132,0 | 117,1 |
| Number of medical outpatient clinics | 62 | 383) |
| Capacity of medical outpatient clinics, visits per shift: | ||
| total, thousand | 12,0 | 11,8 |
| per 10,000 population | 322,2 | 315,8 |
| Number of registered crimes | 17347 | 15848 |
| Persons who committed crimes were identified, people | 4675 | 4495 |
| ENTERPRISES AND ORGANIZATIONS | ||
| Number of enterprises and organizations (at the end of the year; according to state registration) | 24205 | 26610 |
| MINERAL MINING, PROCESSING, PRODUCTION AND DISTRIBUTION OF ELECTRICITY, GAS AND WATER2) | ||
| Number of operating organizations by type of activity (at the end of the year): | ||
| mining | 13 | 2 |
| manufacturing industries | 164 | 119 |
| production and distribution of electricity, gas and water | 51 | 44 |
| Volume of shipped goods of own production, performed works and services by own forces by type of activity, million rubles: | ||
| mining | … | — |
| manufacturing industries | 15125,3 | 19634,3 |
| production and distribution of electricity, gas and water | 9463,9 | 5387,2 |
| CONSTRUCTION | ||
| Volume of work performed for the type of activity “Construction”2), (in actual prices) million rubles. | 1212,9 | 1808,0 |
| Commissioning of social and cultural facilities using all sources of funding: | ||
| residential buildings, thousand m2 of total area | 158,3 | 188,2 |
| apartments (including apartments in dormitories) | 2005 | 2401 |
| preschool institutions, places | — | 250 |
| educational institutions, student places | — | 480 |
| hospital facilities, beds | 60 | — |
| outpatient clinics, visits per shift | 400 | — |
| URBAN PASSENGER TRANSPORT | ||
| Number of routes: | ||
| buses (in intracity traffic) | 23 | 24 |
| trams | 4 | 4 |
| Number of passengers transported per year, million people: | ||
| by bus (in intracity traffic) | 8,6 | 11,7 |
| by trams | 20,2 | 22,2 |
| TRADE2) | ||
| Retail trade turnover (in actual prices), million rubles. | 4915,5 | 4093,6 |
| Index of physical volume of retail trade turnover, as a percentage of the previous year | 161 | 101 |
| Public catering turnover (in actual prices), million rubles. | 355,9 | 363,5 |
| Index of physical volume of public catering turnover, as a percentage of the previous year | 123,9 | 100,3 |
| INVESTMENT2) | ||
| Investments in fixed assets (in actual prices), million rubles. | 6661,4 | 10255,7 |
| Share of investments in fixed assets financed from budgetary funds in the total volume of investments, percent | 62,5 | 52,4 |
| including at the expense of the federal budget | 37,3 | 32,4 |
| __________ 1) Including settlements subordinate to the city administration. 2) For organizations not related to small businesses. 3) Without taking into account micro-enterprises. | ||
Regions of Russia. Main socio-economic indicators of cities - 2009 Copyright © Federal State Statistics Service
How many villages are there in the Khorinsky district?
The administrative-territorial composition of the Khorinsky district includes twenty-seven settlements, the names of which are indicated in the lists below. To find the desired address in the Khorinsky district, use the qualifier below.
Interesting materials:
How to set up OK Google on Xiaomi phone? How to set up data transfer from phone to computer? How to set up data transfer on your phone? How to set up a translator on your phone? How to set up a signature in Gmail on your phone? How to set up a printer on your phone? How to set up a phone for two SIM cards? How to set up a broadcast from your phone to your TV? How to set up Twitch via phone? How to set up flash on your phone?

