This region is located in the interfluve of the Volga and Don, where the Volga, Chernozem and Central regions meet, and therefore the population of the Penza region is very heterogeneous. The characteristics of its settlement indicate an intermediate position among the surrounding areas. Although in terms of natural and climatic conditions it is similar to the Black Earth Region, the population of the Penza region is more inclined towards urbanization, and in this level it significantly exceeds the neighboring regions - the Tambov and Voronezh regions, and is inferior to the Saratov and Ulyanovsk regions. In total, 1,341,526 people live in the Penza region according to Rosstat (2017), of which 930,004 people live in cities.
Characteristic
The urban population of the Penza region is less than the national average, but its number is gradually growing: in 1990, sixty-three percent of the population lived in cities, and in 2005, already sixty-six. This, of course, is not real evidence of urbanization; such trends are observed almost everywhere, since rural areas are constantly losing their population. Just like most of the Russian regions, this region is monocentric. The urban population of the Penza region is half concentrated in the capital of half a million. The cities of Kuznetsk, an industrial center, and Zarechny, a scientific, formerly closed city of Rosatom (ZATO Penza-19), are quite average in size. The remaining towns (there are eight of them) are tiny, more than half of them do not even have ten thousand inhabitants.
Therefore, we can say that the population of the cities of the Penza region (with the exception of the three main ones) leads a semi-rural lifestyle, since the urban infrastructure is rather poorly developed everywhere. In addition, all cities, including Penza, have been losing their residents for the last ten years. The population census of the Penza region eloquently speaks about this. Small towns are depopulating the most (up to twenty percent of the population has been lost in a decade), because during Perestroika, as elsewhere, the food industry and mechanical engineering enterprises that formed their economic base collapsed. The regional center and Zarechny more firmly maintain a young age structure, but even here the population is gradually declining.
Population of the Penza region by district and city
According to him, the urban population decreased to 893 thousand 214 people, the rural population - to 398 thousand 997.
Based on the proposal of the Ministry of Labor, Social Protection and Demography of the Penza Region, for 2022, establish the cost of living per capita at 10,038 rubles, for the working population - 10,941 rubles, pensioners - 9,381 rubles, children - 10,402 rubles.
In January 2022, the situation on the labor market in the Kirov region is characterized as stable, according to the local Employment Center.
Population of Penza for 2022: how many people live by district. Current information about the number of people, what place the city occupies in Russia, growth dynamics over the years. Exact data in table form on our online resource.
Some statistics
The population density of the Penza region is quite close to the average for Russia (its European part), there are thirty-two people per square kilometer. Suburban zones are more densely populated: in Penza, two hundred and sixty, in Kuznetsk, sixty-seven people per square kilometer. The southern regions are agricultural, and therefore have only twelve people per square kilometer. The population of the Penza region is growing slightly due to immigrants, but it is also decreasing a little faster, because people from the outback are leaving not only for Penza.
Rural settlement is characterized by large and medium-sized settlements, which predominate in the Black Earth Region. This slightly mitigates the problems of rural residents' access to basic social services. Nevertheless, about ten percent of the population of the districts of the Penza region has been lost in recent years. The depressed state of the regional economy and, as a consequence, problems with employment are pushing people out of their homes. By the way, the migration outflow is even stronger among neighbors whose regions are just as economically peripheral and where people have the same low incomes - in Mordovia, in the Ulyanovsk and Tambov regions. A rather bleak outlook emerges: the outflow of the population to other regions, where wages are higher, will only increase.
Population of the Penza region for 2022
We shop near our house at the “Store in my area” chain. We rarely go to the market or grocery store - it’s a waste of time, and the prices there are not always lower than store prices.
Now the world has become open, and with the development of the network, people see how they live in other cities and countries, they have a desire for this life with a more developed infrastructure and the benefits of civilization. Conditions in our outback cannot satisfy all these needs, and citizens are leaving in search of a new life. There are also a number of programs that provide funds for living, but they go to a very small part of the population. Last year (compared to 2019), the number of children born decreased by 657 people (6.4%). The number of deaths increased by 4,298 people (23.4%).
Problems
Most of all, the population of the Penza region in 2022 suffers from a lack of social services. Depopulation and aging of the population are much more significant here than in all other regions of the Volga region. This picture is especially depressing in rural areas. How much of the population will remain in the Penza region in five to ten years if drastic measures are not taken to attract people to these fertile lands? The statistics are simply frightening.
Incomes here are very low. A severe economic recession shook the entire region, and the depressive state has not yet passed either in industry (especially in mechanical engineering) or in agriculture. The population does not have any social guarantees, since employment predominates in the informal sectors of the economy. The level of education of the population has dropped significantly, and qualified medical care is practically unavailable in rural areas.
Home For the entire Penza region Historical Library of the Volga Region
M. S. POLUBOYAROV
FROM HISTORY AND DEMOGRAPHY OF THE PENZA REGION
Penza region is one of the central regions of the Russian Federation. Its north-west Until 1521, part of it was part of the Ryazan Principality, to the south and southeast of which the Wild Field began, continuing to Azov and the Caspian Sea. Until sep. 17th century The wild field was the scene of constant clashes between the troops of the Moscow Grand Dukes and the troops of the Crimean Khan, Nogais and “Kuban Tatars” (the general name of the tribes that roamed the Azov region and the North Caucasus). Formally, the Penza part of the Wild Field became part of Russia after the conquest of Kazan and Astrakhan, but in fact - only as a result of the construction of defensive lines of the Penza region in the 17th century. 18th centuries Before the reforms of Peter I, the administration of the territory was carried out mainly by order of the Kazan Palace in Moscow. He was in charge of the affairs of Nizhne- and Verkhnelomovsky, Kerensky, Penza, Insarsky, Saransky, Morshansky, Simbirsk and Petrovsky districts, whose lands, in whole or in part, are now part of the Penza region. In 1779-1780 A number of governorships were formed, incl. Tambov, Penza and Saratov, since 1782 they began to be called provinces. In 1928, by resolutions of the All-Russian Central Executive Committee and the Council of People's Commissars of the RSFSR, the district-provincial administrative-territorial division was abolished, and on February 4, 1939, by the Decree of the Presidium of the Supreme Soviet of the USSR, the Penza region was formed at the expense of part of the Kuibyshev, Saratov and Tambov regions.
Dozens of diagrams from our research show that currently in the Penza region. The process of depopulation is underway. The first sharp decline in population occurred between 1930 and 1939. By the 1960s signs of demographic recovery appeared. However, from the 2nd half. 1990s the destructive trend has resumed. The dynamics of the demographic process from the moment of the cessation of external colonization of the Penza region. at the turn of the 18th and 19th centuries. and up to 2013 are illustrated by the diagrams published at the end of the introductory article. From the 5th revision (1795) to 1930. There was a steady increase in population. During the First World War and the Civil War, its pace decreased, but since a narrow stratum suffered - owners of large property, officials, gendarmes - there was no general decline in population. The beginning of the first demographic catastrophe falls on the period 1930–1939. as a consequence of repressive policies towards the peasantry.
The decline in the indigenous population continues today at an alarming rate. Its victims are no longer only residents of rural areas, but also of cities. An alarming situation has developed not only in the Penza region. Scientists believe: “a comparison of data over the last 25 years shows that all of Russia’s demographic indicators over the twenty years of its independent existence were much worse than in the eighties, the Soviet years”... But if the decline in the birth rate is explained by a number of factors, incl. objective, then a significant increase in mortality is the result of the use of “shock” instruments for reforming the country. The infrastructure that ensured the viability of the population was destroyed... “As a result of such dynamics of fertility and mortality, already in the 90s a special type of population reproduction developed in Russia, which we called Euro-African in those years. With extremely high mortality, the same as in a number of African and part of Asian countries (Egypt, Morocco, Indonesia, Vietnam, etc.), the birth rate dropped to the level of those European countries (Greece, Italy, Spain), where it was and remains the most low. Russia's movement towards a demographic catastrophe continued until the middle of the first decade of the 21st century. In 2005, the number of births, despite a slight increase, was nevertheless only 100 thousand higher than the level of 1995... In general, for 1991-2005. Russia lost approximately 9-10 million human lives from excess mortality relative to the level of the hungry, as it is believed, “sausage-free” 80s.”[1] This is the conclusion of the famous demographer, professor, doctor of economic sciences L.L. Rybakovsky is confirmed by the socio-economic situation in Posurye.
Materials for the historical and topographical description of the Penza region. have been gathering for over 20 years. Some data is out of date. In addition, there were no lists of populated areas in Penza. region for 2015. For some reason, information on settlements based on the results of the All-Russian Population Census of 2010 was not published for a long time. They were replaced by data on village councils. However, the existing ones represent a far from rosy prospect of the threat of death of one of the regions of Russia...
[1] Rybakovsky L.L. Demographic challenges: what awaits Russia? M., 2012.
Population of the Penza region
*
| Districts | 1788 | 1862 | 1911 | 1926 | 1939 | 1959 | 1970 | 1979 | 1989 | 2004 | 2010 | 2013 |
| Bashmakovsky | 23824 | 37816 | 58826 | 71495 | 58978 | 46854 | 41296 | 33244 | 28389 | 26105 | 23304 | 22406 |
| Bekovsky | 13509 | 21936 | 47252 | 55124 | 36269 | 32965 | 29257 | 24915 | 21843 | 18727 | 17531 | 16598 |
| Belinsky | 27011 | 62922 | 110147 | 117590 | 80683 | 58655 | 50848 | 43349 | 39123 | 33971 | 30467 | 27282 |
| Bessonovsky | 24833 | 31314 | 52131 | 63490 | 46586 | 43495 | 45326 | 44130 | 43895 | 43253 | 45296 | 46200 |
| Vadinsky | 10528 | 39108 | 58878 | 57478 | 39294 | 28403 | 21483 | 16707 | 11479 | 11511 | 9807 | 9252 |
| Gorodishchensky | 20074 | 35468 | 59010 | 76172 | 80751 | 73904 | 67162 | 62225 | 58433 | 53077 | 52480 | 51413 |
| Zemetchinsky | 35288 | 49011 | 89565 | 97035 | 93636 | 77884 | 64060 | 48528 | 37564 | 30076 | 24674 | 23241 |
| Issinsky | 18038 | 28094 | 39413 | 43927 | 32702 | 21164 | 18043 | 15438 | 14880 | 12667 | 11157 | 10655 |
| Kamensky | 21450 | 59041 | 93488 | 106274 | 81836 | 73860 | 71214 | 69234 | 67601 | 65619 | 62322 | 60163 |
| Kameshkirsky | 22530 | 33753 | 48305 | 59828 | 38719 | 27341 | 23789 | 19609 | 16930 | 14558 | 12802 | 12217 |
| Kolyshleysky | 21048 | 30455 | 52374 | 63894 | 52337 | 34200 | 30080 | 27214 | 28799 | 27218 | 26187 | 25274 |
| Kondolsky | 14295 | 18557 | 30440 | 39206 | 26300 | 19150 | 15433 | 12942 | 12068 | 10226 | 0** | 0** |
| Kuznetsky | 29602 | 43338 | 64325 | 70653 | 61624 | 49297 | 47271 | 44427 | 41597 | 38347 | 38056 | 37576 |
| Lopatinsky | 21230 | 34881 | 59492 | 62418 | 35571 | 28458 | 24477 | 20108 | 18735 | 16470 | 14942 | 14247 |
| Luninsky | 32841 | 37587 | 62030 | 74200 | 63668 | 49077 | 39200 | 31532 | 26563 | 22399 | 19944 | 19673 |
| Maloserdobinsky | 12957 | 27957 | 48419 | 50710 | 26101 | 20759 | 15848 | 13727 | 12589 | 11930 | 9824 | 9382 |
| Mokshansky | 34743 | 61670 | 94818 | 105303 | 67800 | 49754 | 42679 | 36702 | 33209 | 30735 | 28033 | 27954 |
| Narovchatsky | 25669 | 35425 | 58510 | 55856 | 38384 | 26816 | 23360 | 19396 | 15762 | 14168 | 12069 | 11558 |
| Neverkinsky | 13844 | 21170 | 41892 | 43257 | 30590 | 25276 | 25443 | 22234 | 19119 | 18495 | 16329 | 15565 |
| N.-Lomovsky | 43733 | 66024 | 102476 | 109241 | 87787 | 64572 | 57222 | 55083 | 52335 | 45755 | 41974 | 40412 |
| Nikolsky | 18127 | 43574 | 70673 | 82589 | 77413 | 67787 | 60258 | 51126 | 46788 | 39164 | 34271 | 33433 |
| Pachelmsky | 28012 | 35160 | 55030 | 62170 | 48997 | 41901 | 34092 | 27202 | 22304 | 18602 | 16310 | 15887 |
| Penza | 30980 | 44277 | 70510 | 84596 | 57809 | 52753 | 54479 | 33380 | 43421 | 41785 | 51308 | 53231 |
| Serdobsky | 22366 | 38670 | 70177 | 84926 | 47375 | 57284 | 62757 | 65279 | 65135 | 63740 | 54520 | 52831 |
| Sosnovoborsky | 14978 | 29168 | 45907 | 52099 | 42727 | 38932 | 37120 | 30063 | 24186 | 20016 | 17242 | 16288 |
| Spassky | 18469 | 25652 | 44769 | 42358 | 28295 | 18788 | 18553 | 16776 | 15378 | 13506 | 13008 | 12431 |
| Tamalinsky | 13558 | 21521 | 43645 | 54683 | 38210 | 27298 | 24753 | 23289 | 21325 | 18641 | 16503 | 15539 |
| Shemysheysky | 18422 | 38402 | 67489 | 72461 | 46602 | 36996 | 34021 | 26581 | 22765 | 18904 | 17661 | 17021 |
| Total rural | 631959 | 1051951 | 1739991 | 1959033 | 1467044 | 1193623 | 1079524 | 934440 | 864261 | 777124 | 718021 | 697731 |
| Penza | 8317 | 28496 | 88000 | 91600 | 159800 | 258966 | 373704 | 481599 | 538466 | 509997 | 517311 | 519900 |
| Kuznetsk | 5100 | 12828 | 27353 | 29748 | 37842 | 55896 | 83776 | 93143 | 99490 | 92196 | 88839 | 87157 |
| Zarechny | 6450 | 30000 | 40000 | 55200 | 62651 | 63601 | 63868 | |||||
| Total city | 13417 | 41324 | 115353 | 121348 | 197642 | 321312 | 487480 | 614742 | 693156 | 664844 | 669751 | 670925 |
| Total for the region | 645226 | 1093275 | 1855344 | 2080381 | 1664385 | 1514935 | 1567004 | 1549182 | 1557417 | 1441968 | 1387772 | 1368656 |
*Indicators in red and italics are partly obtained using estimated data.
**Kondolsky district was annexed to Penza in 2006.
Some information presented in the table diverges from official census data (for specific settlements) and is the result of our recalculation. However, the discrepancies do not go beyond 1-2% - such a statistical error is quite acceptable. Part of the demographic material for 1788 and 1937-1939. due to the lack of accurate data, it has estimated indicators. The method for identifying them is outlined below.
The average annual decline in the rural population, including cities of regional subordination and workers' settlements, was in 2004–2013. 8892 inhabitants, 900 people per year. If the current rate of depopulation continues, the countryside may lose its inhabitants within 80 years, that is, within the lifetime of children born today. The process will be uneven. Some areas will be deserted over the next 40-50 years, some will last for a hundred. Following the villages, the cities of Penza, Zarechny, and Kuznetsk will begin to be depopulated. Over the last 10 years, their numbers, thanks to the regional center, have been increasing slightly (if the official statistics are not lying!). However, the main supply of cities comes from the movement of the rural population to large cities and the settlement of visitors from Central Asia and the North. the Caucasus, and since 2014, Ukraine. Natural increase (when the birth rate exceeds the death rate) has stopped and gone backwards. Negative growth for the city of Penza will occur as rural resources are depleted.
Diagram 1.
Absolute number of rural population of the Penza region
(within the administrative boundaries as of January 1, 2014, excluding the city of Penza and the cities of regional subordination Zarechny, Kuznetsk), thousand people.
Diagram 2.
Population of
Penza and the regional cities of Zarechny and Kuznetsk
(thousands of people)
Diagram 3.
Average annual dynamics of population growth/decrease in rural areas
(without three cities of regional subordination),
thousand people*
*Dates 1788 and 1862. taken conditionally as the average dating values of statistical materials that were identified. In most areas of the former Penza province. materials from the 4th revision (1782) were taken into account; a smaller part of the data dates back to 1811. Statistics of the regions of the former Saratov province. dated to the fifth revision (1795). Therefore, 1862 is the average date between 1859 (districts of the Saratov province) and 1864 (Penza districts). Statistics of the Tambov province were published based on information collected in 1862.
Judging by the latest chart, between 2010 and 2013. there is a small average annual population increase compared to 2004–2010. Perhaps this is a consequence of the high all-Russian “demographic wave” of 1983–1987, when in Russia as a whole 2.4–2.5 million children were born annually. Or it is the result of careless statisticians. Some demographers do not rule out the possibility of falsification. This is what Professor Rybakovsky thinks: “Over 10 years (1992–2001), the population of Russia decreased by 3.3%,” while according to the results of the 2010 census, “which clearly overestimated the size of the country’s permanent population, the reduction was 2.2 %". The probabilistic picture of Russia’s demographic development is as follows, the scientist writes, that “by the middle of this century, the population of Russia may approach 100 million people. It is easy to imagine that if every fifty years the country’s population decreases by 1/3 (the latest UN forecasts predict such a reduction in Russia’s population by 2050), then by the end of this century the country’s population will not exceed 65 million, and by the beginning of the 23rd century it will will be approximately 30 million people.”[1]
Rural Russia is experiencing the second major demographic crisis in modern times. stories. The first occurred between 1926 and 1939. According to data for April 1930 for the Middle Volga region,[2] which included three quarters of the current territory of the Penza region, the population everywhere was significantly higher than during the All-Union Census of 1926. The period of maximum decline occurred in 1930–1934 gg., during the years of collectivization. The famine of 1932–1933 played a tragic role in the devastation of Penza villages. Historians note three famine periods in the history of the USSR: 1921–1922, 1932–1933. and 1946–1947, which caused the death of millions of peasants.[3] But if the main reasons for the first were the drought of 1921 and the consequences of wars, the third - the consequences of the war and the drought of 1946, then the cause of the most terrible famine of 1932–1933. The scientist sees, first of all, the subjective factor as “the result of mistakes made during the implementation of the adventuristic policy of complete collectivization, as well as the pronounced terrorist nature of the victorious regime in the USSR.”[4]
Some historians put forward the thesis: collectivization was required in order to obtain gold and foreign exchange reserves for the construction of industrial and energy facilities through the peasantry and the sale of grain abroad. However, in fact, the export of bread provided the USSR budget with an insignificant share of income, measured by a few percent in the structure of the state. funds allocated for industry needs and could not seriously influence investment in industry. Official statistics confirm this. The most complete statistical reference book, published in 1960,[5] provides the following data on grain exports from the USSR (we omit the years of the Civil War and the first years after it: the country was under an economic blockade, and foreign trade had almost no effect on the state budget indicators ).
[1] Rybakovsky A.L. Decree op.
[2] List of populated places in the Middle Volga region. Samara, 1931.
[3] Kondrashin V.V. The famine of 1932–1933: the tragedy of the Russian village. M., 2008. P. 318.
[4] Ibid. P. 333.
[5] Foreign trade of the USSR for 1918–1940. Statistical review. M., 1960. P. 7.
table 2
Export of agricultural products from the USSR
| Years | The amount of exports of all agricultural products. | Including | ||||
| Export of grains | Export of oilseeds | |||||
| Million rubles at the ruble exchange rate as of March 1, 1950 | At the ruble exchange rate of the corresponding years (million rubles) | Tons | Thousand rub. at the exchange rate as of January 1, 1950 | Tons | Thousand rub. at the exchange rate as of January 1, 1950 | |
| 1913 | 2932 | 841 | 9.181.987 | 1.765.172 | 273.643 | 92.155 |
| 1922/23 | 245 | 70 | 727.654 | 129300 | 4.276 | 1619 |
| 1923/24 | 635 | 182 | 2.576.399 | 480.947 | 81.741 | 27.290 |
| 1924/25 | 685 | 197 | 569.310 | 165.533 | 191.773 | 85.960 |
| 1925/26 | 963 | 276 | 2.016.486 | 533.821 | 141.307 | 49.743 |
| 1926/27 | 1016 | 292 | 2.099.318 | 669.844 | 33.972 | 16.327 |
| 1927/28 | 528 | 152 | 288.614 | 91.003 | 56.087 | 19.601 |
| 1928 (Oct-Dec) | 150 | 43 | 139 | 33 | 15.631 | 8.133 |
| 1929 | 565 | 162 | 178.123 | 34.390 | 44.799 | 17.737 |
| 1930 | 1059 | 303 | 4.764.323 | 701.518 | 48.654 | 16.592 |
| 1931 | 780 | 223 | 5.055.688 | 523.293 | 114.461 | 21.928 |
| 1932 | 386 | 111 | 1.727.407 | 180.688 | 259.582 | 41.291 |
| 1933 | 288 | 83 | 1.683.880 | 139.081 | 101.586 | 16.795 |
| 1934 | 221 | 63 | 768.668 | 64.269 | 66.152 | 15.264 |
| 1935 | 271 | 77 | 1.516.791 | 128.071 | 41.261 | 10.288 |
| 1936 | 125 | 157 | 321.314 | 28.313 | 26.684 | 7.290 |
| 1937 | 317 | 420 | 1.276.754 | 194.230 | 48.861 | 8.459 |
| 1938 | 265 | 352 | 2.053.623 | 216.728 | 4.986 | 2.100 |
| 1939 | 87 | 115 | 277.300 | 23.287 | 3.529 | 4.789 |
| 1940 | 484 | 641 | No information | |||
In the reference book “Foreign trade of the USSR for 20 years. 1918 – 1937.” (compiled by S.N. Bakulin and Prof. D.D. Mishustin) give other, approximately half smaller figures for bread exports. Thus, for 1930, 2.5 million tons are shown (instead of 4.7 million), for 1931 - 2.5 (instead of 5 million). “Bakulin” statistics are widely used by modern researchers, but in vain. The Vneshtorg collection (figures from which are given in our table) deserves more confidence. This source has no signs of political conjuncture. It was created exclusively on materials from the USSR Foreign Trade, and statistics from the twenties and thirties were double-checked and clarified. It follows from the table that the most successful years in terms of the volume of grain and oilseeds sold were 1930 and 1931, when about 5 million tons of basic crop products were sold abroad per year. Although this is only half the volume of exports in 1913. Where did 5 million tons come from? Taken away from the “kulaks”? As soon as the main wave of dispossession passed, the volume of grain exports fell and reached “NEP values” only in the late 1930s, thanks to the record harvest collected in 1937. The “Heavenly Office” failed - and grain exports did not even reach half of exports 1924/25 business year (in 1924 there was also a severe drought in a number of regions of the country, including the Volga region).
Low export figures for 1928 and 1929 are explained by organizational reasons: the government carried out a major territorial reform - zoning. The new cadres assigned to the districts were still embarrassed to put pressure on the peasants, remembering Lenin’s demand “not to dare to command a peasant.” Other appointees did not know where to start, having little understanding of their rights and responsibilities. They did not know the morals and customs of the population. After all, as a rule, newcomers were appointed as district leaders. One way or another, the individual peasantry in the twenties, without the means of mechanization, exported more grain than the collective farmers armed with tractors and combines in the thirties. During the years of the first five-year plan (in fact, it lasted four and a quarter years, the fourth quarter of 1928 - 1932 inclusive), the volume of government. capital investments aimed at developing the national economy amounted to 64.5 billion rubles according to plan. at current prices, incl. in industry – 19.1 billion[1] On average, one year accounts for (19.1: 4.25) 4.5 billion rubles. What did the export of bread give? For those sold abroad in 1928 (4th quarter) - 1932. 12.2 million tons of grains and oilseeds received 1.545 million rubles to the budget. at the ruble exchange rate of 1950, or 441.4 million rubles. at the rate of 1928 - 1932 (1 ruble in 1929–1932 corresponded to 3.5 rubles in the 1950s). Or on average for one year of the first five-year plan (441.1: 4.25) 103.8 million rubles. Which is 2.3% of capital investments in industry (groups “A” and “B”). These pitiful 2% could not have any more or less significant significance for the fate of industrialization. It is safe to say that the creation of a powerful industry in the USSR relied on other financial resources. Probably more important were the sale of gold, the requisition of property from wealthy urban nepmen, the free labor of exiled peasants, the low wages of factory workers... Exports in general were one of the weakest points in the USSR economy in the thirties (see diagram 4). Economic ties with the USSR's main partner Germany, with Hitler coming to power, fell into decay. Relations with other large consumers of the market were not improved. Stalin's clumsy, inflexible policy, which could produce positive results in conditions of emergency within the country, was not successful in foreign policy. What was required here was flexibility, experience, knowledge of the laws of the world market, and not cunning and oriental cunning.
[1] History of the national economy of the USSR. Lecture course. M., 1960. P. 510.
Diagram 4
The ratio of the value of exports to the value of the entire gross output of the USSR
(in percentages)
But let’s return to the current demographic crisis... According to the results of the All-Russian population censuses of 2002 and 2010, in the Penza region (excluding the cities of Penza, Zarechny, Kuznetsk and taking into account cities and workers’ settlements) there were, respectively, 507.7 and 456 thousand rural residents. According to operational data as of January 1, 2013 - 441.4 thousand. Thus, the average annual loss of villagers for an 11-year cycle was 6.02 thousand, for a three-year cycle - 4.9 thousand, on average - 5 thousand people . in year. If such rates continue for the coming decades, then in 88 years there will not be a single permanent resident left in rural areas. Of course, this is an average figure. But how many years are left until the day when the last residents leave their native areas.
Table 3
| Districts | Population, people | Average loss, people | How many years will it take for the last residents to leave? | |||
| 2002 | 2010 | 2013 | 2002-13 | 2010-13 | ||
| Bashmakovsky | 25159 | 23304 | 22406 | 250 | 299 | 81 |
| Bekovsky | 18853 | 17531 | 16598 | 205 | 311 | 64 |
| Belinsky | 33569 | 28881 | 27284 | 571 | 532 | 50 |
| Bessonovsky | 41647 | 45296 | 46200 | + | + | + |
| Vadinsky | 11218 | 9807 | 9253 | 178 | 185 | 51 |
| Gorodishchensky | 53126 | 52480 | 51413 | 156 | 356 | 200 |
| Zemetchinsky | 31072 | 24674 | 23241 | 712 | 478 | 39 |
| Issinsky | 12611 | 11157 | 10655 | 178 | 167 | 62 |
| Kamensky | 65684 | 62322 | 60163 | 502 | 720 | 98 |
| Kameshkirsky | 14404 | 12802 | 12217 | 199 | 195 | 62 |
| Kolyshleysky | 27751 | 26187 | 25274 | 225 | 304 | 96 |
| Kuznetsky | 41712 | 38056 | 37576 | 376 | 160 | 140 |
| Lopatinsky | 16190 | 14942 | 14247 | 176 | 232 | 70 |
| Luninsky | 23247 | 19944 | 19673 | 325 | 90 | 95 |
| Maloserdobinsky | 11412 | 9824 | 9382 | 184 | 147 | 57 |
| Mokshansky | 30929 | 28033 | 27954 | 270 | 26 | 189 |
| Narovchatsky | 13839 | 12069 | 11558 | 207 | 170 | 61 |
| Neverkinsky | 18538 | 16329 | 15565 | 270 | 255 | 59 |
| Nizhnelomovsky | 46540 | 41974 | 40412 | 557 | 520 | 75 |
| Nikolsky | 39175 | 34271 | 33433 | 522 | 279 | 83 |
| Pachelmsky | 18995 | 16310 | 15887 | 282 | 141 | 75 |
| Penza** | 51531 | 51308 | 53231 | 20 | + | + |
| Serdobsky | 59655 | 54520 | 52831 | 620 | 563 | 89 |
| Sosnovoborsky | 20510 | 17242 | 16288 | 384 | 318 | 46 |
| Spassky | 13827 | 13008 | 12431 | 127 | 192 | 78 |
| Tamalinsky | 19083 | 16503 | 15539 | 322 | 321 | 48 |
| Shemysheysky | 19063 | 17661 | 17021 | 186 | 213 | 85 |
**In 2002 Penza + Kondolsky.
Thus, only two districts (both suburban) have a positive population balance: Penza and Bessonovsky. There are chances for positive growth in three districts – Gorodishchensky, Kuznetsky and Mokshansky. The remaining 24 districts will disappear from the regional map in the current century.
Read more…>>
NOTES, FOOTNOTES
1. Smith Adam. A study of the nature and causes of the wealth of nations. Per. from English M., 1962. P. 67.
2. In the latest historical literature one can read that the goal of Stalin’s “purges” was to replace leaders, participants in the revolution and civil war, who supposedly only knew how to “wave swords,” with new, more competent leaders. It's a delusion. Our comparison of the educational qualifications of the first (Leninist) composition of the Council of People's Commissars of the USSR, approved at the 2nd session of the All-Russian Central Executive Committee on July 6, 1923, and the Stalinist Council of People's Commissars of the USSR (1939), when the execution campaign was completed, gave the following results. The staffing level of the leaders of the Council of People's Commissars and People's Commissariats in 1923 totaled 17 units (including Rykov held two positions), the Council of People's Commissars of the USSR in 1939 numbered 51 staff units, including chairmen, deputy chairmen of the Council of People's Commissars, people's commissars and chairmen of state committees. We assessed the educational level of people who filled these positions and had higher education at 5 points, incomplete higher education at 4, secondary (graduates from gymnasiums, real and technical schools) at 3, incomplete secondary at 2, primary at 1 point, those who had no education – 0 points. Results obtained: the average staffing unit of the leaders of the Council of People's Commissars in 1923 had an education estimated at 3.37 points (higher - Lenin, Orakhelashvili, Krasin, Sokolnikov; incomplete higher education - Rykov (2 positions), Kamenev, Bryukhanov, Kuibyshev; secondary - Tsyurupa, Trotsky; incomplete secondary - Ordzhonikidze, Dzerzhinsky, Chubar; primary - Schmidt V.V., Smirnov I.N.), Stalin - in 3.8. The difference of half a point in favor of the leaders and people's commissars of the Council of People's Commissars of the USSR in 1939 is too insignificant to seriously talk about Stalin's focus on a personnel revolution in order to install people with higher education as people's commissars. Lenin had difficulties in this regard - his choice was not rich, limited to the circle of revolutionaries. But in 1939, the quality composition, if Stalin wished, could well have reached the “five”, since “Soviet” academies, universities and institutes had been operating in the USSR for more than 20 years. But he needed obedient instruments for the implementation of his criminal plans. Therefore, Stalin’s right hand, Lazar Kaganovich, a man without education, held four positions in 1939 (deputy chairman of the Council of People’s Commissars, people’s commissar of the oil, fuel industry and communications). His brother Mikhail Kaganovich had a primary education, but was in charge of the aviation (!) industry. People's Commissar of Justice Rychkov had no education.
3. Zyuganov G. A. The collapse of the counter-revolution. To the 20th anniversary of the anti-Soviet coup in Russia." M., 2011. pp. 160–161.
4. Rybakovsky L.L. Demographic challenges: what awaits Russia? M., 2012.
5. Ibid.
. Right there.
7. List of populated places in the Middle Volga region. Samara, 1931.
8. Rodina, 1992, No. 11–12. pp. 51–57; The fate of the Russian peasantry. M., 1996. S. 535–557; Writer and leader. Correspondence of M.A. Sholokhov with I.V. Stalin. M., 1997.
9. Kondrashin V.V. The famine of 1932–1933: the tragedy of the Russian village. M., 2008. P. 318.
10. Ibid. P. 333.
11. Foreign trade of the USSR for 1918–1940. Statistical review. M., Vneshtorgizdat, 1960. P. 7.
12. History of the national economy of the USSR. Lecture course. M., 1960. P. 510.
Read the continuation of the article...>>
Read the end of the article...>>
Home For the entire Penza region Historical Library of the Volga Region
Possible benefits
Gradually, in recent years, some social benefits have begun to appear. This is an increase in investment in regional economic structures, so income growth among the population promises to be higher. Naturally, very favorable climatic conditions work as a plus: nature here seems to have been created in order to develop personal subsidiary plots and farming. This, of course, slightly softens the living conditions of the poor population given their lack of resources. In any case, the threat of famine is much less acute. In addition, in this climate, socially determined diseases are not so common.
And the territories of the region themselves, with their historical development as trade and craft centers since the seventeenth century, are conducive to a measured, calm and long life. However, demographic indicators are not encouraging, since they mark the region as long-aged and depopulating. The birth rate here is one of the most problematic in the country, and the overall mortality rate is much higher than the national one. The natural population decline in the Penza region is one percent per year, which is twice as high as the national figure. And in aging villages, the mortality rate reaches a terrible figure - twenty-two percent! It is necessary to facilitate in every possible way the influx of population to these places, and in the last few years this matter seems to have moved forward.
Migration and consequences
In Penza, the population has slightly rejuvenated due to the migration influx, but natural decline is still high. The mortality rate is lower than in rural areas - only fourteen and a half percent, but the birth rate, apparently, is not encouraged in any way, it is much lower than that recorded in the country - less than eight percent. Why is this happening? Because this process began in Soviet times, when young people left the countryside. The age structure of the region is generally similar to all neighboring regions with their high percentage of elderly population.
During the twentieth century, there was a constant migration outflow from the Black Earth Region. Then Perestroika came and the birth rate suffered a huge decline: from 1985 to 2005, the share of children decreased by almost a third. It was 22.5%, but became 14.6%, which brought the region closer to the worst indicators. There are fewer children only in the Nizhny Novgorod region. At the same time, the demographic burden here is very high: six hundred and twenty people are not able to work per thousand of the working-age population.
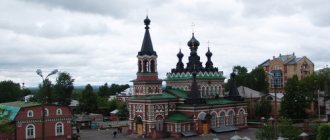
Development
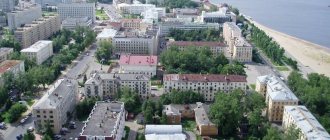
The city received the basis for its development at the turn of the seventeenth and eighteenth centuries, when the status of the settlement changed from a fortress to a civilian one, after which the population of Penza began to actively increase. And the formation of the cultural and administrative center began as a result of the adoption of a master construction plan in 1785, which provided for strictly linear streets. The center of Penza is formed around Cathedral Square. The city was formed according to all the canons of the provincial government with the necessary administrative buildings. By the time of the revolution of 1917, just over one hundred thousand people lived in Penza, and by the time it received the status of a regional center (in 1939), it was already one and a half times more. During the war, many enterprises from the western part of the Soviet Union were moved to this city, which triggered an industrial boom. The population of Penza by 2015 was more than 522 thousand people.
Lifespan
The migration outflow weakened somewhat during the crisis of the nineties, but the influx of migrants to the Penza region was small, despite the excellent natural and climatic conditions and the very low cost of living. When stressful migrations from the CIS countries ended, the Penza region began to lose population again - at the same rates.
It would seem that in this climate life expectancy should be high. Or at least close to the all-Russian one - sixty-five and a half years. However, this figure, in contrast to national trends, is declining here. Longevity in the Penza region is not very good. Life expectancy for rural men is especially low - in 2005 it was fifty-six and a half years. The reason is the huge degree of marginalization of the village.
Population of Penza for 2022. Number of residents of Penza
Data on the number of city residents are taken from the Federal State Statistics Service. The official website of the Rosstat service is www.gks.ru. The data was also taken from the unified interdepartmental information and statistical system, the official website of EMISS www.fedstat.ru. The website publishes data on the number of residents of Penza. The table shows the distribution of the number of residents of Penza by year; the graph below shows the demographic trend in different years.
Links to official documents and resources on the population census are marked with a [*] sign; when you hover your mouse, you will see the title of the document.
| Number of residents of Penza | Years |
| 515,000 people | 2003 |
| 510,000 people | 2005 year |
| 507,047 people | year 2009 |
| 506,297 people | 2010 |
| 519,992 people | year 2012 |
| 519,900 people [*] | year 2013 |
| 521,329 people [*] | year 2014 |
| 522,823 people | 2015 |
| 524,632 people | 2016 |
| 523,726 people | 2017 |
| 523,553 people | 2018 |
| 522,317 people | 2019 |
| 520,300 people | 2020 |
National composition
In the Black Earth Region, Russians make up ninety-five percent or more of the population. However, the Volga region is much richer in this regard, since it is located at the junction of three ethnic areas - Finno-Ugric, Turkic and Slavic. The ethnic composition here is diverse and multifaceted. In the Penza region, more than eighty-six percent are Russian, the rest are mainly Tatars and Mordovians. And in the Shemysheysky, Sosnovoborsky and Neverkinsky districts, these nationalities outnumber the Russian population.
According to the 1989 population census, the region was inhabited by Belarusians, Gypsies, Jews, Azerbaijanis, Ukrainians, Chuvash, Armenians, Germans, Chechens, Uzbeks, Lezgins, Poles, Kazakhs, Avars, Tajiks, Mari, Udmurts, Turkmen, Kyrgyz, Lithuanians, Latvians, Komi and Greeks are all nationalities ranging in size from tenths to hundredths of a percent of the total population. In addition, they did not live there compactly, unlike the Mordovians, Tatars and Chuvashs.
Economy, employment
In terms of the level of economic activity, the population of the Penza region also does not show high results: here the average employment is 66%, and in the country - 64%. This is a consequence of the fact that the region has an older age structure and an increased share of the rural population, where employment is highest, and normal market relations in the agricultural sector were not formed not only in 2005, but even today they leave much to be desired.
Employment in the industrial sector fell by more than a quarter in the decade to 2005. The manufacturing industry lost its personnel even more intensively, although production volumes grew slightly. All this provoked a flow of employment into the service sector, but here too the process was very slow. The trade sector in these years has grown by seventy percent, but this figure hardly fully reflects reality: statistics cannot take into account entrepreneurship that is not registered. Depressed regions with a huge decline in industry and low wages for workers always increase in trade and other informal employment.
Income of the population
In 1999, more than seventy percent of the population of the Penza region was content with incomes much lower than the established subsistence level. That is why the region has become the most problematic of all the constituent entities of the Russian Federation. The severe economic downturn led to a high level of poverty, the purchasing power of residents' incomes was extremely low, and agriculture, where the largest part of the population worked, always paid little.
Poverty rates have decreased slightly in recent years. And yet, across the country, statistics show sixteen percent living below the poverty line, and in the Penza region this percentage is much higher and amounts to twenty-seven percent. Now the region’s indicators are almost on par with other regions of the Volga region.
The population of Penza and the Penza region for 2022 is:
Registration date: 12/06/2016, founder - Limited Liability Company "Penza-Vzglyad". Editor-in-Chief: Pavel Aleksandrovich Shikunov.
If all sorts of penzyuks did not come to Moscow (from the good life in their hometown, one must assume), Muscovites would feel much better. And what a style: to come to someone else’s city and crap on it! One word - penzyuki.
A lot of money was invested, but... apparently, not for long, sorry... You may not like negative comments, but they are true. In this city you really become dumb and gradually turn into a Cattle. It’s not the people who live there, it’s the energy of the city, so if possible, leave!!!
Medicine
Health indicators in the region cannot be assessed unambiguously. Life expectancy is still declining. The incidence of tuberculosis and mortality from it are lower than in Russia as a whole, but the number of deaths from cardiovascular diseases is much higher, which is also due to the aging of the population. Infant mortality in the nineties was lower than all-Russian indicators, but already in the 2000s the Penza region lost this advantage. There were years when no region of the country could compare with it in this regard.
The development and availability of medical services in the region is generally the talk of the town. Here the lowest supply of medical personnel is thirty-seven doctors per ten thousand people, that is, sixty-eighth in the country’s regions. Only in Penza this figure is higher - sixty doctors per ten thousand people. There is definitely a severe shortage of medical care in remote areas.
The Penza region is rapidly losing population
Within a few years, about 3,300 people lived in these places. Fragments of ancient guard buildings have still been preserved: the remains of an earthen rampart can be seen in the very center of the city, and on the western outskirts - a serif line.
In most villages there is no longer a post office, a store, or kindergartens. The school is closed: it is not profitable to maintain a staff of teachers and an entire building because there are three students per village; children are taken to neighboring villages. The situation with FAPs is no better: not a single direct line has passed through the governor without the issue of medical care being raised in the districts.
In 2000 - three times less. In our country, it is considered normal to get stuck in a traffic jam during rush hour and stand there for about an hour.
Several large enterprises operate here, including the largest in the region, and the improvement of the city has long been the envy of many residents of the region. Penza also grew, although not by much - by three thousand people, that is, by 0.5%.
Education
The educational sector also lags behind neighboring regions in many respects. Only sixteen percent of the population over eighteen years of age has a college degree. And the national average according to the 2002 census is nineteen percent. Among rural residents of the Penza region, only seven percent have higher education. The education sector in the region is weak, since neighboring university centers - Saratov and Samara - attract applicants.
There are five state universities in the Penza region, but the branch network is not sufficiently developed. The market for educational services is not developing because the population’s income is too low. There are many students in universities, but the base is very low. There are significantly fewer vocational education institutions.