The Russian Federation, in addition to Russian cities, also includes various republics of other nationalities. These include Tatarstan, whose population consists not only of Tatars. This state has a huge cultural heritage, the study of which is very fascinating. The cities of Tatarstan seem to be very different from each other, but at the same time they have a large number of similar features. It is these moments that we will talk about.
Republic of Tatarstan: area and territories
The area of the Republic of Tatarstan is 67,836 square kilometers. If we consider this area as part of the Russian Federation, then this is less than one percent of the total territory of our country.
Almost the entire republic is located in the zone of plains and steppes; a little more than ninety percent of the territories lie at an altitude of two hundred meters above sea level.
About eighteen percent of the total area of Tatarstan is occupied by forests, with the advantage of deciduous trees. Coniferous forests make up only five percent of the total “green lungs” of Tatarstan. More than four hundred species of different animals live on the plains and forests of the republic.
Tatarstan: brief historical background
People have been building settlements on the territory of the modern republic since approximately the eighth century BC. A little later, the state of the Volga Bulgars was formed here. In this territory they constituted the main population.
Tatarstan, or rather its territory, in the fifteenth century went to the Kazan Khanate, which a hundred years later became part of the Moscow state. Only in the twenties of the last century the name of the state was transformed into the Tatar Autonomous Soviet Socialist Republic. After the collapse of the Soviet Union, the name “Republic of Tatarstan” appeared in official documents.
National composition of residents
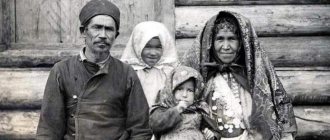
The population of Tatarstan is distinguished by significant national diversity. The main ethnic group is the Tatars (53% of the inhabitants), followed by the Russian population (almost 40% of the republic's inhabitants). Other groups are represented by the Chuvash, Udmurts, Mordovians, Ukrainians, Mari, Bashkirs and many more nationalities and ethnic entities. A total of 7% of the republic’s residents indicated during the census a nationality other than Tatars or Russians.
By the way, the number of indigenous people of the republic is gradually increasing. If in 1926 Tatars made up 48.7% of the population, then by 2002 the figure increased by 4.2%. The share of Russians, accordingly, decreases: from 43% in 1926 to 39.5-39.7% in 2002-2010. Tatars form a majority in 32 of the republic's 43 settlements, while Russians form a majority in 10. In another municipality, the largest population group is the Chuvash.
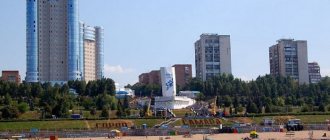
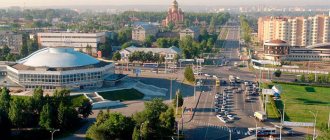
Kazan is the most beautiful city of the republic
In every country, the capital is the most beautiful city. Therefore, it is not surprising that from your first visit to Tatarstan, Kazan will become your all-encompassing love. This city amazes tourists with a unique combination of architectural historical monuments and modern buildings that fit perfectly into the appearance of the capital of Tatarstan.
Every year the flow of tourists seeking to visit Kazan increases. For example, last year more than two million people visited this amazing city. For several years now, the capital of the republic has occupied a leading position in the list of the most popular cities where you can spend the New Year holidays. In addition, Kazan has the official status of “the third capital of Russia”. All this, combined with the extraordinary beauty of the city and the hospitality of its inhabitants, is enough to attract the attention of tourists to the capital of the former Kazan Khanate.
Republic of Tatarstan: population
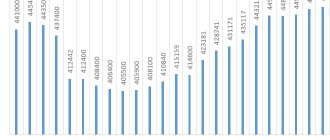
Tatarstan is a densely populated republic. According to the latest data, the population is 3,885,253 people. The annual natural increase of citizens of the republic is 0.2%, this figure allows Tatarstan to hold eighth place in the Russian Federation in terms of population.
The average life expectancy has been at seventy-two years for several years now. This is the highest level in the last thirty years. The favorable situation within the republic is evidenced by the figure characterizing how the population is replenished. Tatarstan is a country where the birth rate remains at a consistently high level. For every thousand people, twelve new citizens are born. Sociologists predict that by 2022 the population of the republic will cross the border to 5,000,000 people.
Tatarstan anti-records
This year, the Atninsky district is leading in terms of mortality rate in the republic - 19.2, while the average for Tatarstan is 12.7. Muslyumovsky (18.9), Tetyushsky (18.8), Yutazinsky (18.2), Apastovsky (18.2) and Rybno-Slobodsky (18.1) districts also showed their anti-records.
A less depressing picture is observed in Nizhnekamsk (10.7), Laishevsky (10.6), Pestrechinsky (10.1) districts and in Naberezhnye Chelny (10.2). Moreover, Laishevo and Pestretsy improved their indicators compared to last year - in 2019 they were 10.9 and 10.4, respectively. Mortality also decreased in Novosheshminsky (from 17.5 to 14.1) and Mendeleevsky (from 12.9 to 12.4) districts. In Kazan, the mortality rate this year was 11.6 (in 2019 - 9.8).
Mortality rate in regions of the Republic of Tatarstan, 2020
| Municipalities | January-December 2022 | January-September 2022 |
| Republic of Tatarstan | 11,00 | 12,70 |
| Atninsky | 12,60 | 19,20 |
| Muslyumovsky | 15,00 | 18,90 |
| Tetyushsky | 17,20 | 18,80 |
| Yutazinsky | 12,80 | 18,20 |
| Apastovsky | 14,50 | 18,20 |
| Rybno-Slobodsky | 16,90 | 18,10 |
| Spassky | 15,40 | 17,90 |
| Alkeevsky | 14,10 | 17,80 |
| Verkhneuslonsky | 14,60 | 17,60 |
| Kaybitsky | 16,60 | 17,50 |
| Chistopolsky | 15,70 | 17,40 |
| Kamsko-Ustinsky | 17,40 | 17,40 |
| Aksubaevsky | 14,60 | 17,10 |
| Aktanyshsky | 16,40 | 17,00 |
| Buinsky | 14,60 | 16,90 |
| Cheremshansky | 15,70 | 16,80 |
| Aznakaevsky | 13,70 | 16,80 |
| Menzelinsky | 15,00 | 16,70 |
| Drozhzhanovsky | 17,80 | 16,50 |
| Mamadyshsky | 13,70 | 16,30 |
| Nurlatsky | 12,40 | 16,00 |
| Alekseevsky | 15,80 | 15,70 |
| Agryzsky | 13,40 | 15,40 |
| Leninogorsky | 13,10 | 14,90 |
| Arsky | 12,10 | 14,80 |
| Tyulyachinsky | 12,80 | 14,80 |
| Sarmanovsky | 13,90 | 14,70 |
| Zelenodolsky | 13,00 | 14,70 |
| Bavlinsky | 13,80 | 14,70 |
| Zainsky | 13,20 | 14,50 |
| Sabinsky | 12,50 | 14,40 |
| Kukmorsky | 11,60 | 14,30 |
| Novosheshminsky | 17,50 | 14,10 |
| Tukaevsky | 13,20 | 13,70 |
| Bugulminsky | 13,20 | 13,40 |
| Baltasinsky | 10,70 | 12,90 |
| Vysokogorsky | 10,70 | 12,70 |
| Mendeleevsky | 12,90 | 12,40 |
| Kazan | 9,80 | 11,60 |
| Almetyevsky | 10,70 | 11,40 |
| Elabuga | 9,50 | 11,20 |
| Nizhnekamsk | 8,90 | 10,70 |
| Laishevsky | 10,90 | 10,60 |
| Naberezhnye Chelny | 8,20 | 10,20 |
| Pestrechinsky | 10,40 | 10,10 |
Mortality rate is the ratio of the number of deaths during a calendar year to the average annual population. Calculated in per mille (per 1,000 population).
In the context of the Volga Federal District, Tatarstan showed the highest mortality rate compared to last year - 118.7% (difference - 6,704 people for the period from January to October 2020). In total, in the Volga Federal District it was 113% (41,460 people). Actually, not a single region of the Volga region was pleased with the low mortality rate - everywhere it exceeds last year’s results. The least number of deaths in the Volga region are in the Kirov region (105.9%, 898 people), Perm region (108.9%, 2,566 people) and Nizhny Novgorod region (109.1%, 3,576 people). In neighboring Bashkortostan - 114.1% (the number of deaths increased by 5,810 people).
In the country as a whole, the mortality rate was 110% (151,191 people). Only two subjects of the Russian Federation showed a decrease in mortality - Buryatia (96.9%, the number of deaths decreased by 285 people) and the city of Sevastopol (99.1, 44 people). Things are worse than in Tatarstan only in three Caucasian republics - Chechnya (136.7%, 1,932 people), Ingushetia (131.9%, 365 people) and Dagestan (131.4%, 3,756 people).
The number of registered births and deaths in Russia for January - October 2022
| Subject | Born | increase, decrease | 2020 as a percentage of 2022 | Deceased | increase, decrease | 2020 as a percentage of 2022 | Natural increase, decrease (-) | Number of deaths as a percentage of the number of births | ||||
| 2020 | 2019 | 2020 | 2019 | 2020 | 2019 | 2020 | 2019 | |||||
| Russian Federation | 1.193.445 | 1.250.608 | -57.163 | 95,4 | 1.661.372 | 1.510.181 | 151.191 | 110,0 | -467.927 | -259.573 | 139,2 | 120,8 |
| Central Federal District | 295.410 | 311.557 | -16.147 | 94,8 | 464.011 | 416.617 | 47.394 | 111,4 | -168.601 | -105.060 | 157,1 | 133,7 |
| Belgorod region | 10.348 | 11.104 | -756 | 93,2 | 18.631 | 17.453 | 1.178 | 106,7 | -8.283 | -6.349 | 180,0 | 157,2 |
| Bryansk region | 7.880 | 8.447 | -567 | 93,3 | 15.838 | 14.785 | 1.053 | 107,1 | -7.958 | -6.338 | 201,0 | 175,0 |
| Vladimir region | 8.402 | 9.607 | -1.205 | 87,5 | 19.289 | 17.802 | 1.487 | 108,4 | -10.887 | -8.195 | 229,6 | 185,3 |
| Voronezh region | 15.880 | 16.664 | -784 | 95,3 | 29.801 | 27.559 | 2.242 | 108,1 | -13.921 | -10.895 | 187,7 | 165,4 |
| Ivanovo region | 6.300 | 6.686 | -386 | 94,2 | 13.694 | 13.144 | 550 | 104,2 | -7.394 | -6.458 | 217,4 | 196,6 |
| Kaluga region | 7.452 | 7.625 | -173 | 97,7 | 13.366 | 12.371 | 995 | 108,0 | -5.914 | -4.746 | 179,4 | 162,2 |
| Kostroma region | 4.547 | 4.859 | -312 | 93,6 | 8.215 | 7.845 | 370 | 104,7 | -3.668 | -2.986 | 180,7 | 161,5 |
| Kursk region | 7.504 | 7.778 | -274 | 96,5 | 14.824 | 13.920 | 904 | 106,5 | -7.320 | -6.142 | 197,5 | 179,0 |
| Lipetsk region | 7.832 | 8.344 | -512 | 93,9 | 15.689 | 13.693 | 1.996 | 114,6 | -7.857 | -5.349 | 200,3 | 164,1 |
| Moscow region | 66.848 | 60.860 | 5.988 | 109,8 | 88.004 | 76.293 | 11.711 | 115,4 | -21.156 | -15.433 | 131,6 | 125,4 |
| Oryol Region | 4.836 | 5.069 | -233 | 95,4 | 10.202 | 9.573 | 629 | 106,6 | -5.366 | -4.504 | 211,0 | 188,9 |
| Ryazan Oblast | 7.331 | 7.862 | -531 | 93,2 | 15.493 | 14.274 | 1.219 | 108,5 | -8.162 | -6.412 | 211,3 | 181,6 |
| Smolensk region | 5.431 | 6.008 | -577 | 90,4 | 12.468 | 11.932 | 536 | 104,5 | -7.037 | -5.924 | 229,6 | 198,6 |
| Tambov Region | 6.269 | 6.557 | -288 | 95,6 | 13.870 | 12.823 | 1.047 | 108,2 | -7.601 | -6.266 | 221,2 | 195,6 |
| Tver region | 8.452 | 9.183 | -731 | 92,0 | 18.424 | 17.245 | 1.179 | 106,8 | -9.972 | -8.062 | 218,0 | 187,8 |
| Tula region | 8.983 | 9.531 | -548 | 94,3 | 21.403 | 19.573 | 1.830 | 109,3 | -12.420 | -10.042 | 238,3 | 205,4 |
| Yaroslavl region | 8.790 | 9.625 | -835 | 91,3 | 16.521 | 15.568 | 953 | 106,1 | -7.731 | -5.943 | 188,0 | 161,7 |
| Moscow | 102.325 | 115.748 | -13.423 | 88,4 | 118.279 | 100.764 | 17.515 | 117,4 | -15.954 | 14.984 | 115,6 | 87,1 |
| Northwestern Federal District | 106.367 | 112.847 | -6.480 | 94,3 | 158.711 | 145.536 | 13.175 | 109,1 | -52.344 | -32.689 | 149,2 | 129,0 |
| Republic of Karelia | 4.301 | 4.667 | -366 | 92,2 | 7.714 | 7.422 | 292 | 103,9 | -3.413 | -2.755 | 179,4 | 159,0 |
| Komi Republic | 6.260 | 6.672 | -412 | 93,8 | 8.465 | 8.330 | 135 | 101,6 | -2.205 | -1.658 | 135,2 | 124,9 |
| Arhangelsk region | 7.959 | 8.698 | -739 | 91,5 | 12.988 | 12.560 | 428 | 103,4 | -5.029 | -3.862 | 163,2 | 144,4 |
| Nenets Autonomous Okrug | 497 | 514 | -17 | 96,7 | 354 | 315 | 39 | 112,4 | 143 | 199 | 71,2 | 61,3 |
| Arkhangelsk region without autonomy | 7.462 | 8.184 | -722 | 91,2 | 12.634 | 12.245 | 389 | 103,2 | -5.172 | -4.061 | 169,3 | 149,6 |
| Vologda Region | 8.957 | 9.587 | -630 | 93,4 | 13.923 | 13.768 | 155 | 101,1 | -4.966 | -4.181 | 155,4 | 143,6 |
| Kaliningrad region | 7.793 | 7.902 | -109 | 98,6 | 10.159 | 10.027 | 132 | 101,3 | -2.366 | -2.125 | 130,4 | 126,9 |
| Leningrad region | 11.048 | 11.319 | -271 | 97,6 | 22.293 | 19.581 | 2.712 | 113,9 | -11.245 | -8.262 | 201,8 | 173,0 |
| Murmansk region | 5.409 | 5.634 | -225 | 96,0 | 7.824 | 7.117 | 707 | 109,9 | -2.415 | -1.483 | 144,6 | 126,3 |
| Novgorod region | 4.067 | 4.338 | -271 | 93,8 | 8.476 | 8.196 | 280 | 103,4 | -4.409 | -3.858 | 208,4 | 188,9 |
| Pskov region | 4.189 | 4.507 | -318 | 92,9 | 9.228 | 8.882 | 346 | 103,9 | -5.039 | -4.375 | 220,3 | 197,1 |
| Saint Petersburg | 46.384 | 49.523 | -3.139 | 93,7 | 57.641 | 49.653 | 7.988 | 116,1 | -11.257 | -130 | 124,3 | 100,3 |
| Southern Federal District | 129.816 | 135.525 | -5.709 | 95,8 | 190.776 | 176.637 | 14.139 | 108,0 | -60.960 | -41.112 | 147,0 | 130,3 |
| Republic of Adygea | 3.625 | 3.454 | 171 | 105,0 | 4.757 | 4.722 | 35 | 100,7 | -1.132 | -1.268 | 131,2 | 136,7 |
| Republic of Kalmykia | 2.312 | 2.337 | -25 | 98,9 | 2.387 | 2.177 | 210 | 109,6 | -75 | 160 | 103,2 | 93,2 |
| Republic of Crimea | 15.621 | 16.133 | -512 | 96,8 | 23.730 | 22.590 | 1.140 | 105,0 | -8.109 | -6.457 | 151,9 | 140,0 |
| Krasnodar region | 49.273 | 51.126 | -1.853 | 96,4 | 62.816 | 58.190 | 4.626 | 107,9 | -13.543 | -7.064 | 127,5 | 113,8 |
| Astrakhan region | 8.973 | 9.196 | -223 | 97,6 | 10.777 | 9.661 | 1.116 | 111,6 | -1.804 | -465 | 120,1 | 105,1 |
| Volgograd region | 16.266 | 17.852 | -1.586 | 91,1 | 30.635 | 27.514 | 3.121 | 111,3 | -14.369 | -9.662 | 188,3 | 154,1 |
| Rostov region | 30.325 | 31.841 | -1.516 | 95,2 | 50.831 | 46.896 | 3.935 | 108,4 | -20.506 | -15.055 | 167,6 | 147,3 |
| Sevastopol | 3.421 | 3.586 | -165 | 95,4 | 4.843 | 4.887 | -44 | 99,1 | -1.422 | -1.301 | 141,6 | 136,3 |
| North Caucasus Federal District | 112.027 | 111.476 | 551 | 100,5 | 70.015 | 60.338 | 9.677 | 116,0 | 42.012 | 51.138 | 62,5 | 54,1 |
| The Republic of Dagestan | 37.636 | 37.996 | -360 | 99,1 | 15.727 | 11.971 | 3.756 | 131,4 | 21.909 | 26.025 | 41,8 | 31,5 |
| The Republic of Ingushetia | 6.885 | 6.623 | 262 | 104,0 | 1.509 | 1.144 | 365 | 131,9 | 5.376 | 5.479 | 21,9 | 17,3 |
| Kabardino-Balkarian Republic | 8.737 | 8.376 | 361 | 104,3 | 6.696 | 5.990 | 706 | 111,8 | 2.041 | 2.386 | 76,6 | 71,5 |
| Karachay-Cherkess Republic | 4.295 | 4.349 | -54 | 98,8 | 3.853 | 3.469 | 384 | 111,1 | 442 | 880 | 89,7 | 79,8 |
| Republic of North Ossetia-Alania | 6.874 | 7.218 | -344 | 95,2 | 6.610 | 6.046 | 564 | 109,3 | 264 | 1.172 | 96,2 | 83,8 |
| Chechen Republic | 24.754 | 23.320 | 1.434 | 106,1 | 7.202 | 5.270 | 1.932 | 136,7 | 17.552 | 18.050 | 29,1 | 22,6 |
| Stavropol region | 22.846 | 23.594 | -748 | 96,8 | 28.418 | 26.448 | 1.970 | 107,4 | -5.572 | -2.854 | 124,4 | 112,1 |
| Volga Federal District | 224.598 | 237.302 | -12.704 | 94,6 | 360.524 | 319.064 | 41.460 | 113,0 | -135.926 | -81.762 | 160,5 | 134,5 |
| Republic of Bashkortostan | 34.408 | 35.421 | -1.013 | 97,1 | 47.137 | 41.327 | 5.810 | 114,1 | -12.729 | -5.906 | 137,0 | 116,7 |
| Mari El Republic | 5.542 | 5.673 | -131 | 97,7 | 7.604 | 6.865 | 739 | 110,8 | -2.062 | -1.192 | 137,2 | 121,0 |
| The Republic of Mordovia | 4.647 | 5.056 | -409 | 91,9 | 10.029 | 8.822 | 1.207 | 113,7 | -5.382 | -3.766 | 215,8 | 174,5 |
| Republic of Tatarstan (Tatarstan) | 34.353 | 35.939 | -1.586 | 95,6 | 42.605 | 35.901 | 6.704 | 118,7 | -8.252 | 38 | 124,0 | 99,9 |
| Udmurt republic | 12.043 | 12.361 | -318 | 97,4 | 16.898 | 15.055 | 1.843 | 112,2 | -4.855 | -2.694 | 140,3 | 121,8 |
| Chuvash Republic (Chuvashia) | 9.394 | 9.774 | -380 | 96,1 | 14.880 | 12.797 | 2.083 | 116,3 | -5.486 | -3.023 | 158,4 | 130,9 |
| Perm region | 21.207 | 22.646 | -1.439 | 93,6 | 31.494 | 28.928 | 2.566 | 108,9 | -10.287 | -6.282 | 148,5 | 127,7 |
| Kirov region | 8.822 | 9.549 | -727 | 92,4 | 16.127 | 15.229 | 898 | 105,9 | -7.305 | -5.680 | 182,8 | 159,5 |
| Nizhny Novgorod region | 22.896 | 24.457 | -1.561 | 93,6 | 42.958 | 39.382 | 3.576 | 109,1 | -20.062 | -14.925 | 187,6 | 161,0 |
| Orenburg region | 15.656 | 16.577 | -921 | 94,4 | 24.445 | 21.631 | 2.814 | 113,0 | -8.789 | -5.054 | 156,1 | 130,5 |
| Penza region | 8.098 | 8.782 | -684 | 92,2 | 18.076 | 15.370 | 2.706 | 117,6 | -9.978 | -6.588 | 223,2 | 175,0 |
| Samara Region | 23.317 | 24.874 | -1.557 | 93,7 | 41.030 | 35.274 | 5.756 | 116,3 | -17.713 | -10.400 | 176,0 | 141,8 |
| Saratov region | 15.579 | 16.991 | -1.412 | 91,7 | 31.041 | 28.083 | 2.958 | 110,5 | -15.462 | -11.092 | 199,2 | 165,3 |
| Ulyanovsk region | 8.636 | 9.202 | -566 | 93,8 | 16.200 | 14.400 | 1.800 | 112,5 | -7.564 | -5.198 | 187,6 | 156,5 |
| Ural federal district | 109.010 | 114.435 | -5.425 | 95,3 | 133.069 | 121.742 | 11.327 | 109,3 | -24.059 | -7.307 | 122,1 | 106,4 |
| Kurgan region | 6.143 | 6.541 | -398 | 93,9 | 11.153 | 10.779 | 374 | 103,5 | -5.010 | -4.238 | 181,6 | 164,8 |
| Sverdlovsk region | 36.722 | 39.278 | -2.556 | 93,5 | 52.202 | 48.512 | 3.690 | 107,6 | -15.480 | -9.234 | 142,2 | 123,5 |
| Tyumen region | 38.429 | 39.616 | -1.187 | 97,0 | 27.126 | 24.051 | 3.075 | 112,8 | 11.303 | 15.565 | 70,6 | 60,7 |
| Khanty-Mansiysk Autonomous Okrug-Yugra | 17.066 | 17.560 | -494 | 97,2 | 9.834 | 8.424 | 1.410 | 116,7 | 7.232 | 9.136 | 57,6 | 48,0 |
| Yamalo-Nenets Autonomous Okrug | 5.897 | 5.735 | 162 | 102,8 | 2.516 | 2.116 | 400 | 118,9 | 3.381 | 3.619 | 42,7 | 36,9 |
| Tyumen region without autonomy | 15.466 | 16.321 | -855 | 94,8 | 14.776 | 13.511 | 1.265 | 109,4 | 690 | 2.810 | 95,5 | 82,8 |
| Chelyabinsk region | 27.716 | 29.000 | -1.284 | 95,6 | 42.588 | 38.400 | 4.188 | 110,9 | -14.872 | -9.400 | 153,7 | 132,4 |
| Siberian Federal District | 141.772 | 150.788 | -9.016 | 94,0 | 198.642 | 186.306 | 12.336 | 106,6 | -56.870 | -35.518 | 140,1 | 123,6 |
| Altai Republic | 2.444 | 2.521 | -77 | 96,9 | 1.985 | 1.890 | 95 | 105,0 | 459 | 631 | 81,2 | 75,0 |
| Tyva Republic | 5.389 | 5.177 | 212 | 104,1 | 2.491 | 2.314 | 177 | 107,6 | 2.898 | 2.863 | 46,2 | 44,7 |
| The Republic of Khakassia | 4.455 | 4.717 | -262 | 94,4 | 5.676 | 5.533 | 143 | 102,6 | -1.221 | -816 | 127,4 | 117,3 |
| Altai region | 16.604 | 17.978 | -1.374 | 92,4 | 28.912 | 27.573 | 1.339 | 104,9 | -12.308 | -9.595 | 174,1 | 153,4 |
| Krasnoyarsk region | 24.255 | 25.705 | -1.450 | 94,4 | 30.918 | 29.646 | 1.272 | 104,3 | -6.663 | -3.941 | 127,5 | 115,3 |
| Irkutsk region | 22.734 | 23.877 | -1.143 | 95,2 | 27.571 | 26.496 | 1.075 | 104,1 | -4.837 | -2.619 | 121,3 | 111,0 |
| Kemerovo region | 18.851 | 20.408 | -1.557 | 92,4 | 33.759 | 32.015 | 1.744 | 105,4 | -14.908 | -11.607 | 179,1 | 156,9 |
| Novosibirsk region | 24.029 | 25.512 | -1.483 | 94,2 | 33.076 | 30.061 | 3.015 | 110,0 | -9.047 | -4.549 | 137,7 | 117,8 |
| Omsk region | 14.735 | 16.084 | -1.349 | 91,6 | 23.322 | 20.657 | 2.665 | 112,9 | -8.587 | -4.573 | 158,3 | 128,4 |
| Tomsk region | 8.276 | 8.809 | -533 | 93,9 | 10.932 | 10.121 | 811 | 108,0 | -2.656 | -1.312 | 132,1 | 114,9 |
| Far Eastern Federal District | 74.445 | 76.678 | -2.233 | 97,1 | 85.624 | 83.941 | 1.683 | 102,0 | -11.179 | -7.263 | 115,0 | 109,5 |
| The Republic of Buryatia | 10.481 | 10.530 | -49 | 99,5 | 8.851 | 9.136 | -285 | 96,9 | 1.630 | 1.394 | 84,4 | 86,8 |
| The Republic of Sakha (Yakutia) | 10.566 | 10.774 | -208 | 98,1 | 6.968 | 6.427 | 541 | 108,4 | 3.598 | 4.347 | 65,9 | 59,7 |
| Transbaikal region | 10.267 | 10.596 | -329 | 96,9 | 11.152 | 11.017 | 135 | 101,2 | -885 | -421 | 108,6 | 104,0 |
| Kamchatka Krai | 2.717 | 2.783 | -66 | 97,6 | 3.141 | 2.901 | 240 | 108,3 | -424 | -118 | 115,6 | 104,2 |
| Primorsky Krai | 14.991 | 15.425 | -434 | 97,2 | 21.766 | 21.582 | 184 | 100,9 | -6.775 | -6.157 | 145,2 | 139,9 |
| Khabarovsk region | 11.369 | 12.146 | -777 | 93,6 | 15.222 | 14.849 | 373 | 102,5 | -3.853 | -2.703 | 133,9 | 122,3 |
| Amur region | 6.526 | 6.660 | -134 | 98,0 | 9.563 | 9.295 | 268 | 102,9 | -3.037 | -2.635 | 146,5 | 139,6 |
| Magadan Region | 1.099 | 1.117 | -18 | 98,4 | 1.380 | 1.367 | 13 | 101,0 | -281 | -250 | 125,6 | 122,4 |
| Sakhalin region | 4.650 | 4.778 | -128 | 97,3 | 5.228 | 5.108 | 120 | 102,3 | -578 | -330 | 112,4 | 106,9 |
| Jewish Autonomous Region | 1.334 | 1.439 | -105 | 92,7 | 1.925 | 1.866 | 59 | 103,2 | -591 | -427 | 144,3 | 129,7 |
| Chukotka Autonomous Okrug | 445 | 430 | 15 | 103,5 | 428 | 393 | 35 | 108,9 | 17 | 37 | 96,2 | 91,4 |
Ethnic composition of the former Kazan Khanate
Throughout Russia there is no such multinational state as Tatarstan. According to the latest data, more than one hundred and fifteen nationalities live here, all of which are historically established populations. Since ancient times, Tatarstan has served as a haven for numerous ethnic diasporas. This policy turned out to be very beneficial for the state, because all peoples are united and conflicts based on interethnic hostility have never arisen in the country.
Now the state is home to eight nationalities, which number more than ten thousand people, among them Russians, Maris and Tatars. The most numerous include the following nationalities:
- Tatars - more than two million people;
- Russians - about one and a half million people;
- Chuvash - one hundred twenty-six and a half thousand people.
As a percentage, Tatars make up fifty-two percent of the total population, Russians make up thirty-nine and a half percent of the population, and the Chuvash, respectively, make up three percent of the citizens of Tatarstan.
About the settlements and main nationalities of the republic
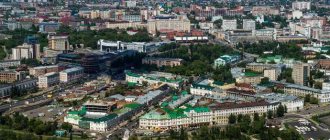
The number of settlements, in addition to the million-plus city of Kazan, includes another twenty-six cities. Three of them (Naberezhnye Chelny, Nizhnekamsk, Almetyevsk) have more than 100 thousand inhabitants. More than 50 thousand live in settlements such as Zelenodolsk, Bugulma, Elabuga, Leninogorsk, Chistopol. The Republic of Tatarstan is incredibly multinational. Its population is diverse. It has more than 173 nationalities. Among them:
- Tatars (about 53.2% of the total population);
- Russians (39.7%);
- Chuvash (3.1%);
- Udmurts (0.6%);
- Bashkirs (0.36%);
- other nationalities (less than 3.1%).
The population size by region shows that the percentage of Tatars in almost all regions is somewhat less than that of Russians.
Economic development of Tatarstan
The economy of Tatarstan is one of the most developed in the Russian Federation. It ranks sixth in the country in terms of production volumes. The petrochemical industry plays a major role in the republic. In Tatarstan, they are engaged not only in oil production, but also in its refining, which brings significant funds to the state budget and raises its authority among the constituent entities of the Russian Federation.
The share of mechanical engineering in the industrial complex of the country is large, which attracts foreign investment to the republic. According to information from last year, Tatarstan cooperated with one hundred and thirty world powers, with imports and exports accounting for approximately the same percentage.
From the first decade of this century, the Republic of Tatarstan began reorganizing the housing stock. Over six years, more than three hundred thousand square meters of housing were put into operation in the country. In parallel, the construction of satellite cities of Kazan and the construction of sports and entertainment institutions at the federal level began. This brought Tatarstan to a new level in the international sports arena, which, in turn, provides the republic’s budget with additional funds allocated for the development of the region’s economy.
Economists have long been pleased with the monthly increase in production in the republic, equal to 0.1%. If this trend continues, then in a few years Tatarstan will completely overcome its dependence on the oil industry, which over the past year has shown itself to be extremely unstable. All other constituent entities of the Russian Federation that depend on this industry have significantly reduced their economic growth. The Republic very far-sightedly directed the received investments into the development of the chemical industry, managing with its help to ultimately cover the existing budget deficit.
Despite the fact that inflation in the republic is slowly but steadily growing, the standard of living in Tatarstan remains consistently high. The Republic is one of the five regions of Russia with the highest standard of living. Now it ranks fourth, behind the constant leaders of the list - Moscow, St. Petersburg and the Moscow region.
The Republic of Tatarstan can be considered one of the most unique subjects of the Russian Federation. Sociologists and economists predict rapid growth in the region in the near future, which will take the republic to a completely new level of development.
Cities of republican significance
The cities of republican significance Kazan and Naberezhnye Chelny form urban districts at the municipal level.
The remaining cities of republican significance are included in municipal districts and, according to the Register[2], in administrative districts (which contradicts the law on the administrative-territorial structure[1]).
city (urban district) Kazan
| № | Locality | Type | Population |
| 1 | Kazan | city | 1 257 391 |
Aznakaevo city
It is part of the Aznakaevsky municipal district (and, according to the Register[2], administrative).
| № | Locality | Type | Population |
| 1 | Aznakaevo | city | 34 197 |
Almetyevsk city
It is part of the Almetyevsky municipal district (and, according to the Register[2], administrative).
| № | Locality | Type | Population |
| 1 | Almetyevsk | city | 158 429 |
Bavly city
It is part of the Bavlinsky municipal district (and, according to the Register[2], administrative).
| № | Locality | Type | Population |
| 1 | Bavly | city | 22 157 |
Bugulma city
It is part of the Bugulma municipal district (and, according to the Register[2], administrative).
| № | Locality | Type | Population |
| 1 | Bugulma | city | 82 488 |
Buinsk city
It is part of the Buinsky municipal district (and, according to the Register[2], administrative).
| № | Locality | Type | Population |
| 1 | Buinsk | city | 20 416 |
Yelabuga city
It is part of the Elabuga municipal district (and, according to the Register[2], administrative).
| List of settlements | |||
| № | Locality | Type | Population |
| 1 | Elabuga | city | 73 962 |
| 2 | Tarlovka[9] | village | |
city of Zainsk
It is part of the Zainsky municipal district (and, according to the Register[2], administrative).
| List of settlements | |||
| № | Locality | Type | Population |
| 1 | Zainsk | city | 39 631 |
| 2 | Karmalka | village | 265 |
Zelenodolsk city
It is part of the Zelenodolsk municipal district (and, according to the Register[2], administrative).
| № | Locality | Type | Population |
| 1 | Zelenodolsk | city | 100 039 |
Leninogorsk city
It is part of the Leninogorsk municipal district (and, according to the Register[2], administrative).
| № | Locality | Type | Population |
| 1 | Leninogorsk | city | 61 695 |
city (urban district) Naberezhnye Chelny
| № | Locality | Type | Population |
| 1 | Naberezhnye Chelny | city | 533 839 |
Nizhnekamsk city
It is part of the Nizhnekamsk municipal district (and, according to the Register[2], administrative).
| List of settlements | |||
| № | Locality | Type | Population |
| 1 | Dmitrievka | village | 21 |
| 2 | Ilyinka | village | 44 |
| 3 | Nizhnekamsk | city | 240 020 |
Nurlat city
It is part of the Nurlat municipal district (and, according to the Register[2], administrative).
| № | Locality | Type | Population |
| 1 | Nurlat | city | 32 014 |
Chistopol city
It is part of the Chistopol municipal district (and, according to the Register[2], administrative).
| List of settlements | |||
| № | Locality | Type | Population |
| 1 | Eryklinsky | village | 8 |
| 2 | Chistopol | city | 59 446 |