In the Volgo-Vyatsky region in the Volga district is the Kirov region, whose population is 1,200 thousand people, of which 76% is urban. The list of cities in the Kirov region includes 18 settlements, the largest being the administrative center - Kirov. Founded in 1174 as the city of Vyatka, then it was renamed in 1457 to Khlynov, and in 1780 the previous name was returned. Only in 1934 did it begin to bear the name Kirov, where 500 thousand people currently live.
Geographical features
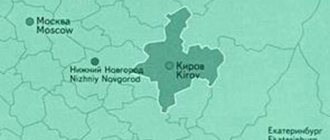
This region is located in the northeast of the Russian Plain. The size of the region along the meridian is 570 km, and in the latitudinal direction – 440 km. The distance from Kirov to Moscow is 896 km. The region is located within the Moscow time zone.
The Kirov region is characterized by hilly terrain. The northern part is significantly swampy. The climate is temperate, closer to cold. Severe frosts often occur in winter, and sudden cold snaps in summer. Precipitation amount is 500–700 mm per year. The region is characterized by a high level of forest cover.
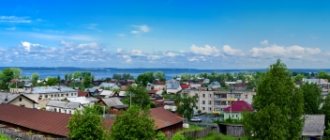
Slobodskoy is a typical regional town
The population of the city of Slobodskaya, as in the previous case, has been demonstrating a stable outflow of people for 10 years. Now more than 32 thousand people live here. For people, Slobodskaya can only be attractive in relation to work at local plants. In this regard, the city cannot be called densely populated, because there is not a wide variety of attractions or opportunities for higher education. Slobodskoy is interesting from a historical point of view, so it is often included in tourist routes. Here you can see many churches and chapels, since Orthodoxy is a very widespread religion.
The Kirov region is characterized by the same problems as many other regions with their small settlements. It is premature to talk about overcrowding, but the lack of an adequate pace of development can lead to corresponding problems - people simply will have nowhere to live. The only impetus for population growth remains the industrial sector, which can attract people for permanent residence. However, workers cannot always count on decent wages, which is why they tend to move to big cities. At the moment, the largest city in the Kirov region ranks 37th in terms of population among Russian cities. It is the only one showing positive dynamics in terms of population growth. Significant problems in the Kirov region are related to the lack of places in schools and kindergartens. Residents of Kirov feel this especially acutely. The problem is due to the fact that new municipal buildings take a long time to build, but growth occurs quite quickly. This is another reason for migration to larger cities. The Kirov region needs to take timely measures to provide residents with housing and municipal buildings (primarily schools and kindergartens). This applies to all regional cities showing population growth. Their potential may be quite large, but it will not be possible to evaluate it if local authorities do not receive a budget for development. It is simply impossible to attract people to live in small towns if they do not have all the conditions for a comfortable life. The region has the job opportunities and experience that young professionals need, but there are no suitable conditions for those who already have families. Despite the funds allocated from the state budget, there is an irrational use of financial resources and, at the same time, illiterate development of the housing sector is registered.
Population of the Kirov region
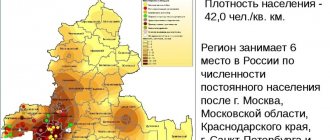
The Kirov region is one of the largest in the European part of Russia. The total population of the Kirov region, according to 2018 data, is 1,283,400 people. At the same time, the average population density is 10.66 people. per km2. The share of city residents is 76.82%.
The region is characterized by an outflow of residents to other regions of the country: mainly to those located to the south and west of the Kirov region. Many moved to Yaroslavl and Moscow.
The population has been declining since at least 1900. During this time, it fell more than 2 times. Back in 2009, the population density was significantly higher – 11.3 people/km2. The share of urban residents, on the contrary, is lower – 72.1%. The working population was 911 thousand people.
The average life expectancy is very low and ranges from 60 to 70 years, depending on the year of birth.
Small towns up to 20 thousand people
Yaransk
Population 16,283 people (2016).
Sovetsk (Kirov region)
There are other meanings of this name, see Sovetsk
Population 15,719 people (2016).
Sosnovka
Population 11,420 people (2016).
The city, among other things, is home to the Sosnovsky Shipyard.
Zuevka
Population 10,697 people (2016).
White Kholunitsa
Population 10,597 people (2016).
Population 10,461 people (2016).
Urzhum
Population 9,975 people (2016).
Nolinsk
Population 9,703 people (2016).
Kearse
Population 9,639 people (2016).
Malmyzh
Population 7,591 people (2016).
Orlov
Population 6,834 people (2016).
Murashi
Population 6,384 people (2016).
National population structure
In 2010, representatives of more than 100 different nationalities lived in the Kirov region. Russians make up over 90% of the residents of the Kirov region. In second place are the Tatars - up to 3%. The share of Ukrainians is 0.76%. It is somewhat higher among local national communities - Mari and Udmurts (2.6 and 1.2%, respectively). There are small numbers of Azerbaijanis, Armenians, Gypsies, Belarusians, Germans, Chuvashs and Moldovans. The presence of other nationalities is insignificant. For example, there are only 0.03% of Jews.
In many areas of the region, the share of Russians is more than 95%. For example, in Kirov there are from 96 to 97% of them. The fewest Russian residents are in the Mamlyzhsky district - 45.4%, which is largely due to the high number of Tatars.
The most rural nationality is the Mari. More than 70% of them live in rural areas.
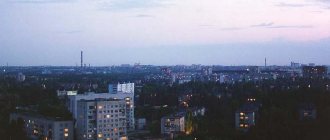
Kirov is the capital of the Kirov region
The population in Kirov has shown annual growth over the past 8 years. The increase is mainly due to visitors of Russian nationality. This became possible thanks to the development of the industrial sector. The city produces rubber and plastic products, there is metallurgical and food production. A number of industrial enterprises operate on the territory.
The list of them is long, among them there is the famous “Kirovsky”. Due to the high population, traffic jams constantly occur. This settlement has a well-developed transport infrastructure, which is an undeniable advantage. However, it is not designed for a large number of people, so without government help it will not be able to expand further. The capital needs economic injections and support. Construction of new areas is currently underway, including:
- Chistye Prudy;
- Sunny Beach;
- Southern;
- Urvantsevo.
The last of the named areas caused a big scandal. Its main problem, according to most residents, is that the money was simply stolen. This is indicated by the current state of the area. From 2006 to 2013 Frames were erected for only 3 houses. Unscrupulous contractors carried out communications incorrectly, which greatly slowed down the implementation of the project. The authorities, however, are promising in every possible way to put the area in order so that it can become part of a large area called the South-Western region.
Population by city
The population of the cities of the Kirov region is uneven. The most populated city is Kirov. Over 500 thousand people live here. Kirovo-Chepetsk is in second place. About 73 thousand people live here. In other cities, the population is much lower. Almost everywhere there is a decrease in population. The only exception is the city of Kirov, where it grows. The largest cities are concentrated in the center of the region.
Content
- 1 Largest cities 500 thousand - 1 million people 1.1 Kirov
- 2.1 Kirovo-Chepetsk
- 3.1 Yaransk
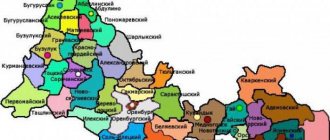
Population of the Kirov region by district
The region is divided into a large number of districts. However, the population of the districts of the Kirov region varies quite a lot. The most populated area in the Kirov region is the urban district of Kirov. Over 475 thousand people live here. In other regions the population is many times lower.
The most sparsely populated area is Bogorodsky district. Only 4,955 people live there. Almost the entire population there is Russian.
Region population forecasts
Forecasts for the population dynamics of the Kirov region are rather discouraging. According to Kirovstat, every year the number of residents will decrease by approximately 5-7 thousand people. By 2031, the population of this region will be approximately 1,177,000 people.
The most rapid decline is expected in the rural population, partly due to migration to cities. However, according to forecasts, the number of urban residents will also decrease.
The ratio of men to women will remain approximately the same as now. There will still be more men than women.
The population of older age groups will grow by 5–8 thousand people until 2022, after which it will begin to decrease. In 2022 there will be approximately 393 thousand pensioners, and in 2031 – 379 thousand. Now there are about 367 thousand of them.
Natural population decline will increase. If now it is about 2,000 people per year, then in 2030 it will be about 5,400 people per year. A decrease in the birth rate is expected from 2022. At this time, a peak in migration outflow is expected, which will then gradually decrease.
However, there will also be positive trends. Thus, by the 2030s, average life expectancy in the region is expected to increase. For women it will approach 80 years, and for men – 71.
see also
- Kirov region
- Cities of Russia
| [ + ] Cities by regions of Russia | |
| Cities of the North-West (NWFD) | St. Petersburg (and its cities) • Leningrad region (historical Staraya Ladoga) • Arkhangelsk region • Vologda region • Kaliningrad region • Karelia • Komi • Murmansk region • Nenets Autonomous Okrug • Pskov region |
| Cities of the Volga region (Volga Federal District) | Bashkortostan • Volgograd region • Kalmykia • Kirov region • Mari El • Mordovia • Nizhny Novgorod region • Orenburg region • Penza region • Perm region • Samara region • Saratov region • Tatarstan • Udmurtia • Ulyanovsk region • Chuvashia |
| Cities of Southern Russia (SFD) | Sevastopol (including Inkerman) • Republic of Crimea • Adygea • Astrakhan region • Krasnodar region • Rostov region |
| Cities of the North Caucasus (NCFD) | Dagestan • Ingushetia • Kabardino-Balkaria • Karachay-Cherkessia • North Ossetia - Alania • Stavropol Territory • Chechen Republic |
| Cities of the Urals (Ural Federal District) | Kurgan region • Sverdlovsk region • Tyumen region • Khanty-Mansi Autonomous Okrug - Yugra • Chelyabinsk region • Yamalo-Nenets Autonomous Okrug |
| Cities of Siberia (Siberian Federal District) | Altai Republic • Altai Territory • Irkutsk Region • Kemerovo Region • Krasnoyarsk Region • Novgorod Region • Novosibirsk Region • Omsk Region • Tomsk Region • Tyva • Khakassia |
| Cities of the Far East (FEFD) | Amur Region • Buryatia • Jewish Autonomous Region • Trans-Baikal Territory • Kamchatka Territory • Magadan Region • Primorsky Territory • Sakha (Yakutia) • Sakhalin Region • Khabarovsk Territory • Chukotka Autonomous Region |
| see also | Cities of the DPR, LPR, Transnistria, South Ossetia • Regions of Russia • Cities of Russia |
Employment
According to official reports from the regional employment center, the employment situation in the region is stable. The unemployment rate is very low at only 1.1%. The total number of unemployed is 7,700 people. It is also noted that this figure is the lowest in the entire history of the center.
Employment levels vary greatly across areas. In 19 districts of the region, official unemployment exceeds the average by 2 times, and in five districts - by 3 times. The lowest unemployment rate is in Kirov, as well as in the Sovetsky, Urzhumsky, and Slobodsky districts.
In 2016, the number of vacancies provided by Kirov employers was 20 percent more than in the same period last year. The largest number of available vacancies (i.e., shortage of personnel) is observed in such areas as construction, mechanical engineering, information technology and agriculture.
There are also plenty of vacancies for doctors and engineers.
It is difficult to get a job in the Kirov region in such professions as lawyer, economist, accountant. Competition for 1 workplace in the listed specializations ranges from 5 to 18 people registered with the center.
List of settlements in the Kirov region according to the 1989 All-Union Population Census
This section contains the administrative-territorial division and a list of settlements in the Kirov region in 1989. In preparing this section, collections of the results of the 1989 All-Union Population Census, published by the Kirov Regional Statistics Department in 1990, were used.
From the 1st volume (“Population and its distribution by gender, age, marital status, number and size of families”), information was taken on the population size by districts and cities of regional significance, as well as information on urban settlements. From the 3rd volume (“Rural settlements”), information was taken on the population of village councils and rural settlements.
Typing and data processing were performed by the Rodnaya Vyatka portal. Read about the preparation of this publication in the editorial blog >>
.
Summary table of districts and cities of regional significance
To view information on village councils, click on the link with the name of the district.
| Item no. | Area | Center | Cities | P.g.t. | Selsovetov | Us. points | Sources
| ||||||||||||||||||||||||||||||||||||||||||||||||||||||||||||||||||||||||||||||||||||||||||||||||||||||||||||||||||||||||||||||||||||||||||||||||||||||||||||||||||||||||||||||||||||||||||||||||||||||||||||||||||||||||||||||||||||||||||||||||||||||||||||||||||||||||||||||||||||||||||||||||||||||||||||||||||||||||||||||||||||||||||||||||||||||||||||||||||||||||||||||||||||||||||||||||||||||||||||||||||||||||||||||||||||||||||||||||||||||||||||||||||||||||||||||||||||||||||||||||||||||||||||||||||||||||||||||||||||||||||||||||||||||||||||||||||||||||||||||||||||||||||||||||||||||||||||||||||||||||||||||||||||||||||||||||||||||||||||||||||||||||||||||||||||||||||||||||||||||||||||||